

Regardless of the exam scenario for your school, the IB has clearly communicated the significance and value of predicted grades. In February 2021 IB released a dual route to the May 2021 assessments, along with an allocation of predicted grades. If you have questions about how predicted grade allocations for your school or subject were determined, check out our explanation of how your predicted grade allocations were determined. Additionally, IB School Improvement held a series of free webinars to help the IB community understand these allocations and plan for student success. If you happened to miss these sessions you can access the presentation and videos links.
The remainder of this article will lay out an action plan given your predicted grade allocation, and explain how to use this information to better support students in these difficult and challenging times.
Understand your history of predicted grade alignment to IB score
Before we can create an action plan to better align our predicted grades we need to first understand what the current alignment is between our predicted grades and the final awarded grades. This information is located in IBIS, where the IB provides detailed results for the past exam session. Though these exports are extremely rich with information, for some, they are difficult to manipulate in ways that provide teachers and leaders with detailed information.
The IB presents data files to analyze your history of predicted grades in IBIS:
· Subject Results CSV
· Candidate Results CSV
· Component Results CSV
These three files cannot be used as is, they must be pulled into a spreadsheet program and further manipulated to make the information more user friendly. To help save you time and resources, IB School Improvement provides a service to create a dynamic and interactive visualization tool that empowers leaders and teachers with immediate, detailed and actionable feedback.
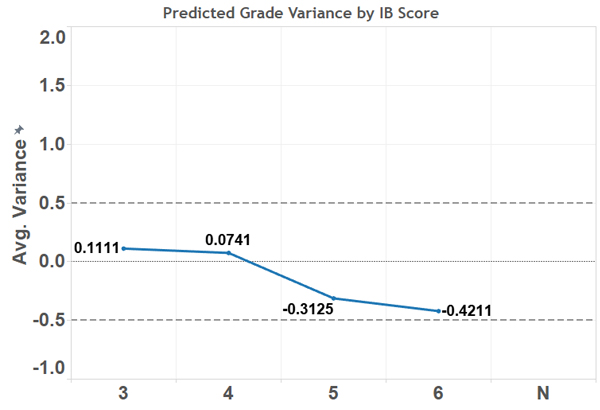
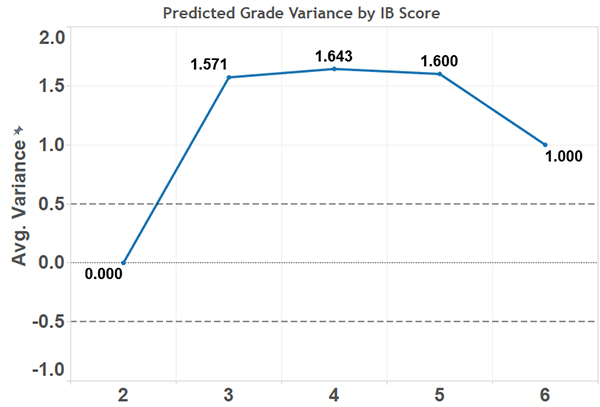
One way to check the historic alignment of your predicted grades is to look at your predicted grade variance. This compares predicted grades with final grades. If the average difference between those two numbers is +/- 0.5 for a subject and level, then they are in good shape.
Good Variance:
Bad Variance:
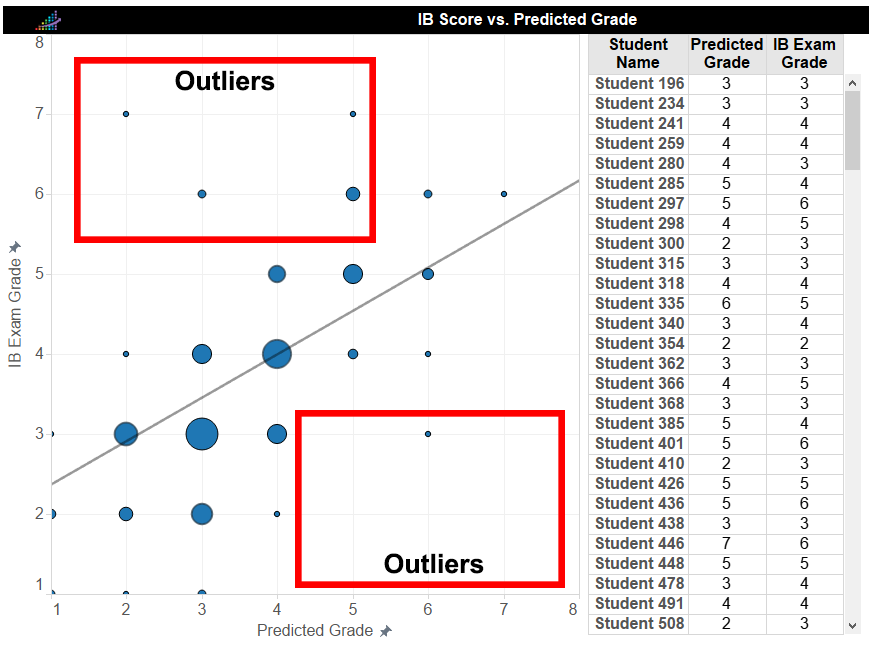
After understanding the variance for your class, the best way to go about addressing the variance is to understand your outliers. Outliers are students that fall well outside the what should be considered an acceptable difference between the predicted grade and the final awarded grade. This is often times easily accomplished by creating a scatter plot of predicted grade on the x-axis and final grade on the y-axis. Any dots that fall in the top left (predicted low, but scored high) or the bottom right (predicted high, but scored low) are outliers.
Finally, your teachers and teams need to reflect on your practice of awarding predicted grades. Having these conversations help to bring underlying practices to light. This will also help to shift from applying generous or conservative predicted grades to applying accurate predicted grades. One question that might help teachers with this conversation is "How do your predicted grades align with course grades?". For example is a 6 indicative of an A in your class, and a 5 a B? Lastly, consider a standards-based grading model to bring course grades, predicted grades, and IB scores into alignment.
If you found this article interesting and would like to receive more articles like this, sign up for our newsletter here.